“Mr. Jones” in DSD and PCM
It’s hot in Southern California. It’s a beautiful day at the beach and I’m sure there are thousands of people trying to escape the heat by romping in the Pacific Ocean waves. They watch the slowly moving Cessnas (airplanes) cruise by with huge banners pitching this or that brand (hey, maybe I should hire them to drag a big banner with the RealHD-Audio.com logo…think it would work?). But I’m not at the beach. I did run 10 miles along the bike path before the sun came up yesterday but today, I spent the morning painting one of the rooms in the front of the building…yes, I’m the maintenance person here at the world headquarters of AIX Media Group as well as everything else. Oh well.
With the first coat drying, I thought I would revisit the Counting Crows .dsf file that I downloaded from SuperHiRez.com the other day and compare it to the CD that I have of the same album. It was tough but I did purchase a license to the Audirvana Plus player so that I could play DSD files. I used up my free 15-day license the last time I wanted to hear a DSD file.
I ripped the CD into my Mac easily and took a quick look at the spectragraph. The typical thing…overly compressed rock music. The dynamic range for Mr. Jones (the group’s first big hit) hovers around 25 dB, which is actually not too terrible.
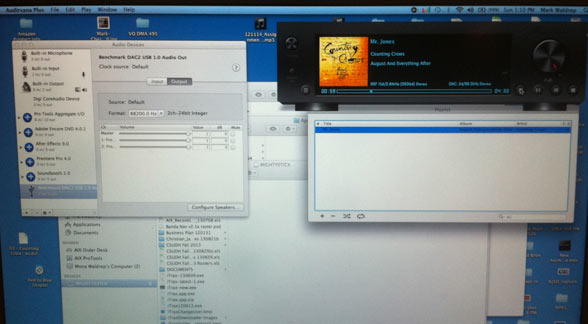
Then I took a USB memory stick into the main room and plugged it into my Mac Book Pro because that’s where the new installation of Audirvana Plus was put. I connected a USB cable from the Mac to my new Benchmark DAC2 (the one that handles DSD playback so well) and then used the balanced line outputs through my analog to digital converters back to PCM at 96 kHz/24-bits. The intent here is not to be pristine about the audio quality but rather to be able to take a look at the files in Adobe Audition…although it did sound quite good.
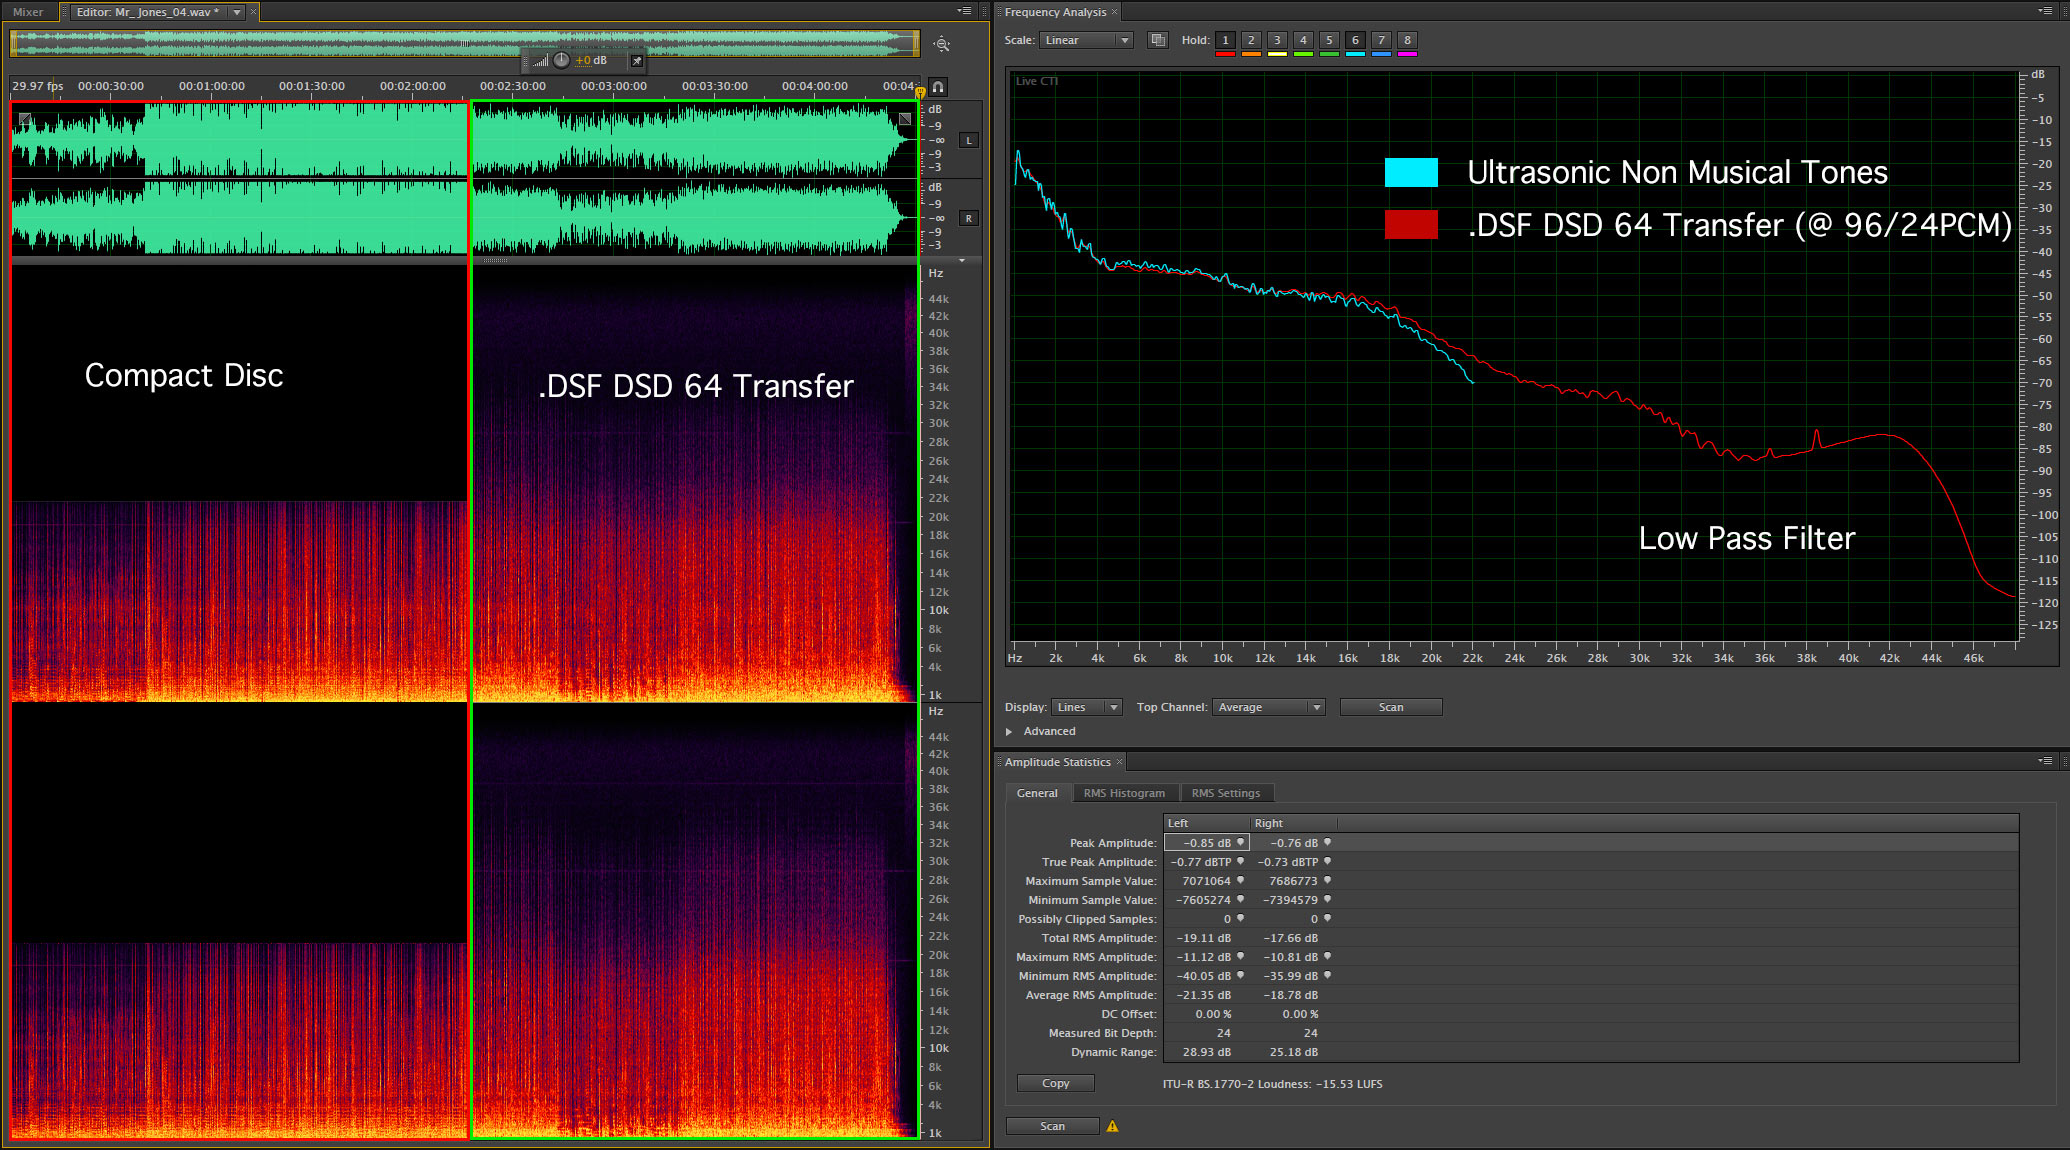
Figure 1 – The spectragraph of the Counting Crows “Mr. Jones” from the CD and from the DSD captured at 96/24. Click to enlarge.
The first thing that I noticed about the two different versions was the heavy compression that was applied during the mastering phase of the CD version. The green waveform at the top left of Figure 1 is just about completely flat after the introduction. The DSD version must have come from another master because there is far less compression. I’m impressed and wondering what master was used for the DSD transfer. This is clearly a step in the right direction.
The spectragraph below shows the plot of the CD on the left hand side of the timeline and then the converted DSD file from SuperHiRez.com. Of course, the CD doesn’t have any frequencies above the Nyquist Frequency of 22.050 kHz…that’s also why the blue line on the right hand plot of the same signal abruptly stops at 22k. Interestingly, you can detect two faint horizontal lines at about 10 kHz and another at 19 kHz. I can’t really speculate on the first tone but the second is probably the HF carrier associated with video monitors. Some TVs would spew a 19.2 kHz tone when playing. It used to drive me crazy to walk by the computer music lab at CSUN years ago because I could hear that tone.
The original multitrack recording was done on 2″ analog tape and mixed in analog through a Neve console to analog tape (I happen to know that console because a close friend of mine sold it to the group). So there’s actually more ultrasonics in the DSD file, again a good thing. Analog recording make ideal candidates for HD-Audio transfers…especially to 96 kHz/24-bit PCM so you can take advantage of the ultrasonics.
The spectra of the .dsf file looks pretty good until you get to about 34 kHz and then it turns into the “purple haze” indicative of DSD 1-bit encoding. You can clearly see the analog tape bias frequency at 38.4 kHz and then the signal was subjected to a Low Pass Filter as it closes in on 46 kHz. The plot is pretty typical except that the HF noise seems a little attenuated.
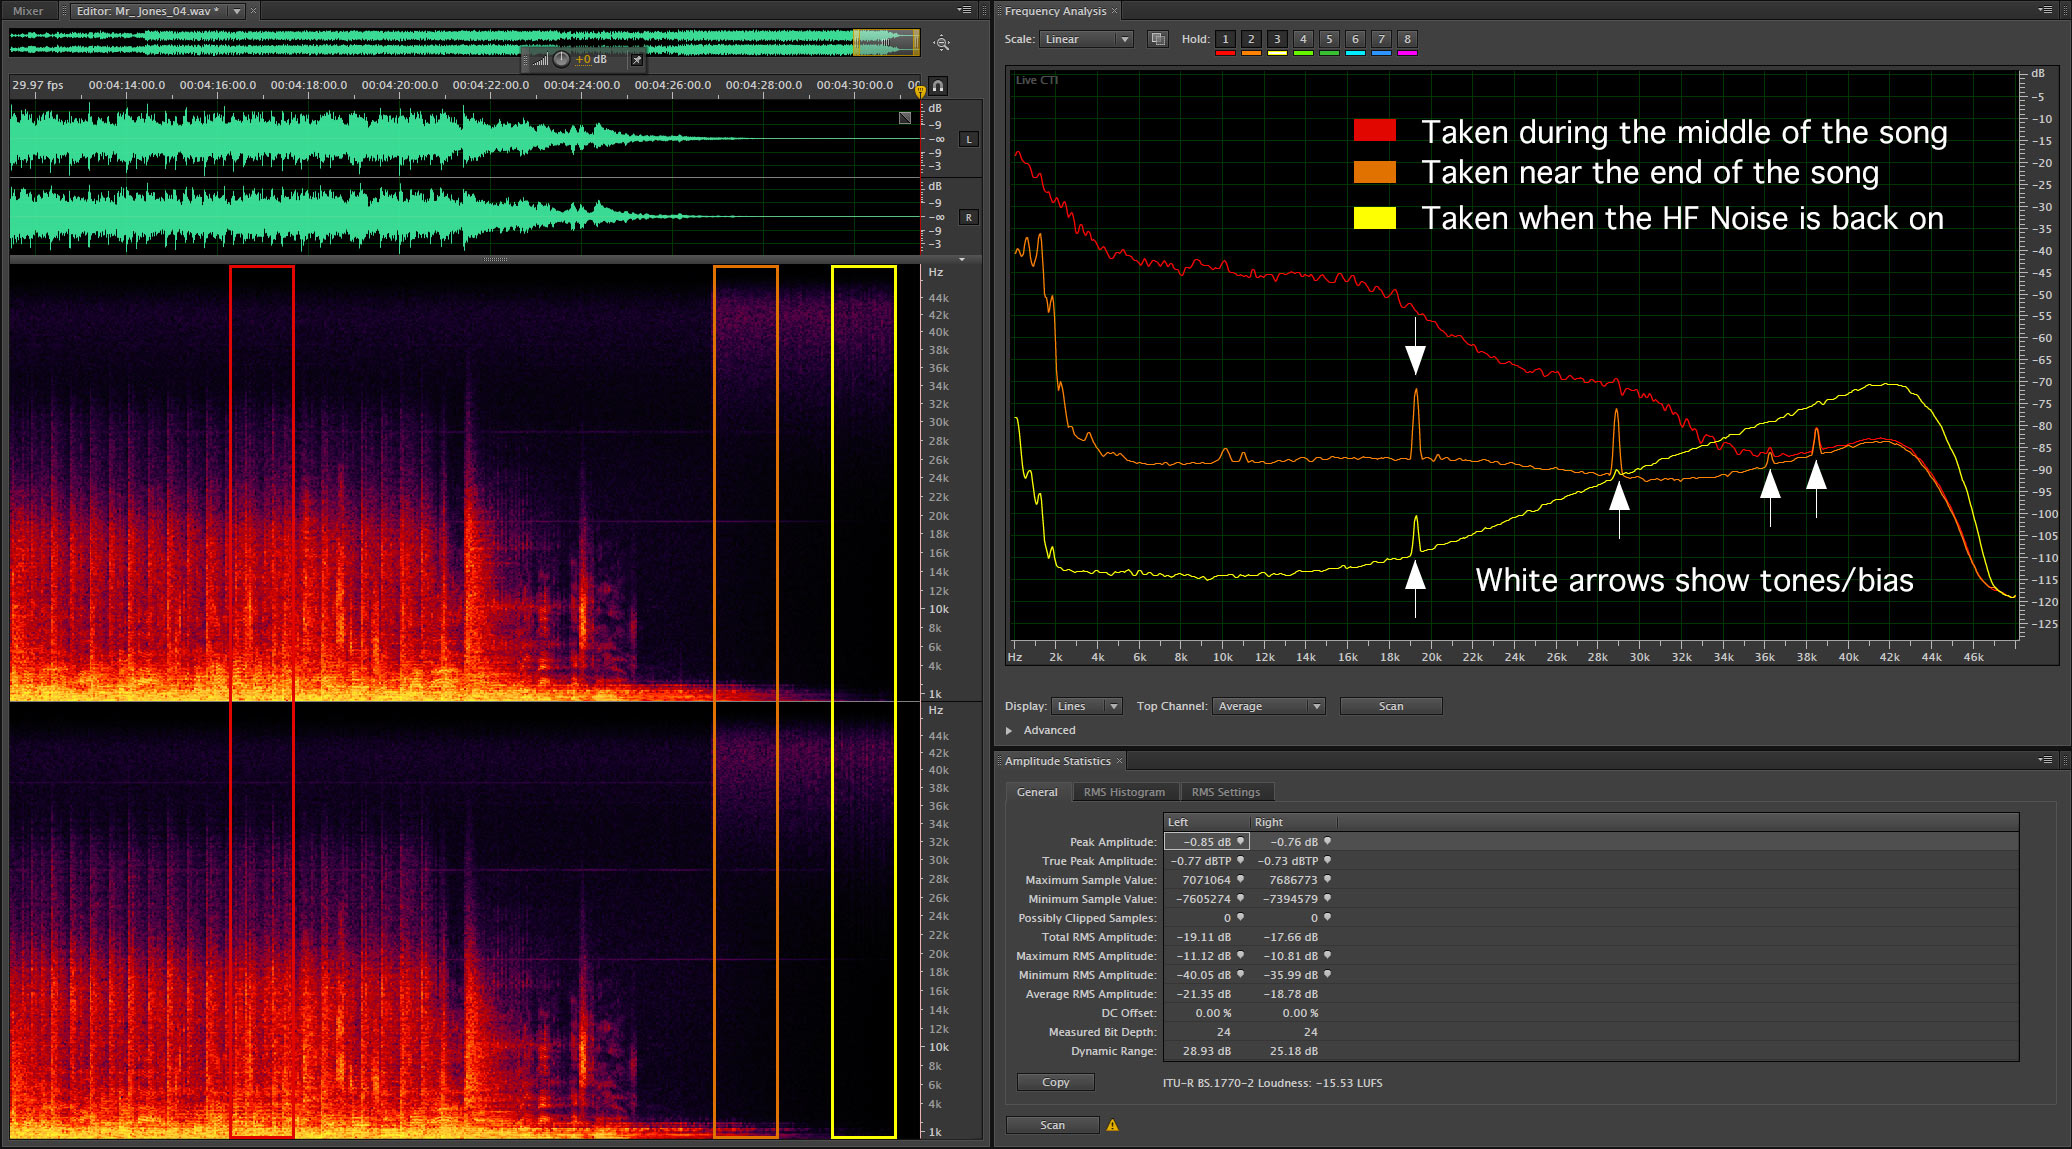
As I zoomed into the end of the selection, I noticed something very strange. You can just make it out at the very end of the timeline. There’s a much brighter patch of the purple haze. Figure 2 below is an enlargement of the last 10-15 seconds of “Mr. Jones”.
Figure 2 – The ending segment of the same tune magnified to show the switching of off the equalization/filter. Click to enlarge.
It is apparent the engineer that worked on this file (I haven’t looked at any of the others) reduced the amount of the HF noise using an equalizer or high frequency LPF. The faint purple noise snaps back to its normal amplitude just three seconds before the end of the selection. Why? The YELLOW trace on the right hand plot shows the true nature of the DSD HD noise. It’s easily 12-15 dB louder than the RED plot, which is the amount present throughout the tune. The 12-15 dB attenuation is a typical max value for an analog EQ. I don’t know if this is what was used but it is consistent with the spectra. But why would it be switched off just prior to the end of the tune.
There are also some new tones spread throughout the frequency range. You see the 19.2 kHz, one at 29 kHz, 36 kHz and 30 kHz.
So was my $25 well spent on the DSD version of this album? I do appreciate that there is slightly more dynamic range on the DSD version than the CD but I don’t appreciate the games that are being played with the HF DSD noise. It seems to me either you accept that it’s there or you don’t. Trying to EQ it doesn’t help anything.
This whole exercise makes me want to have a go at a real HD-Audio transfer of the analog mixes used to make the DSD file. I would love to have the dynamics and ultrasonics without the spurious tones and noise…now that would be worth listening to.
I applaud Chad and SuperHiRez.com for getting one of my favorite albums on his site as a better digital file. I’m not sure it’s worth $25 but I was encouraged that the heavily mastered CD wasn’t used for the transfer to DSD.


